Employee Retention. Part 2: Predictive Modeling
Project Overview and Purpose
- Built a Predictive Model that can predict whether or not an employee will leave the company and help identify factors that contribute to leaving
Logistic Regression model assumptions
Outcome variable is categorical
Observations are independent of each other
No severe multicollinearity among X variables
No extreme outliers
Linear relationship between each X variable and the logit of the outcome variable
Sufficiently large sample size
During the project, I tried to answer these questions:
Do you notice anything odd?
Which independent variables did you choose for the model and why?
Is each of the assumptions met?
How well does your model fit the data?
Can you improve the model? Is there anything you would change about the model?
Model Building (Logistic Regression)
Fit a model that predicts the outcome variable using two or more independent variables.
Identify the type of prediction task
The goal is to predict whether an employee leaves the company, which is a categorical outcome variable. So this task involves classification. More specifically, this involves binary classification, since the outcome variable left can be either 1 (indicating employee left) or 0 (indicating employee didn't leave).
Identify the types of models most appropriate for this task
Since the variable we want to predict (whether an employee leaves the company) is categorical, we need to build a Logistic Regression model. The binomial logistic regression suits our task because it involves binary classification.
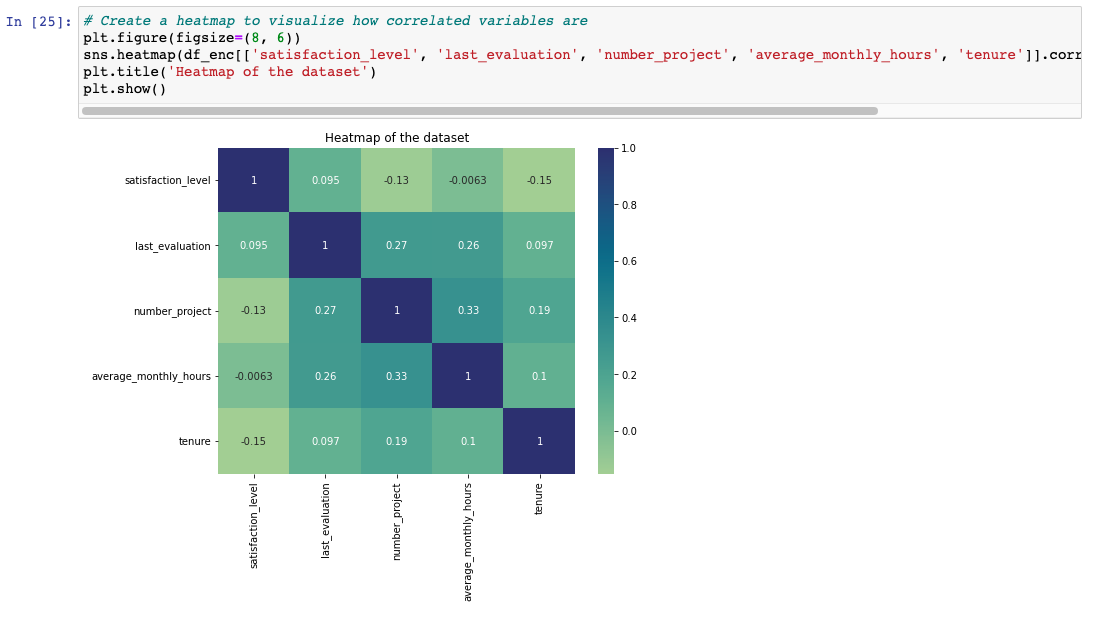
Next, I created a heatmap to visualize how correlated variables are and consider which variables are interesting for examining correlations between them.
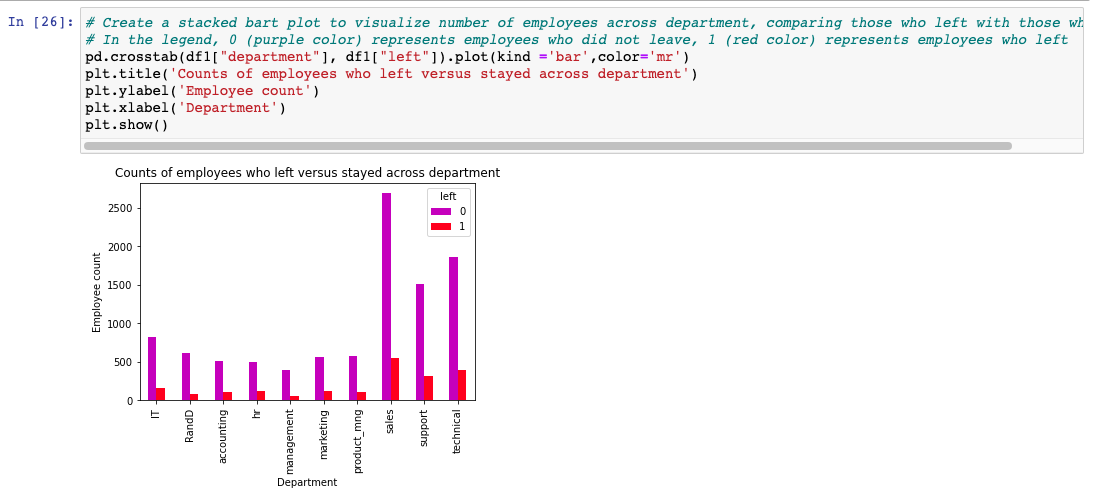
Next, I created a stacked bart plot to visualize number of employees across departments, comparing those who left with those who didn't:
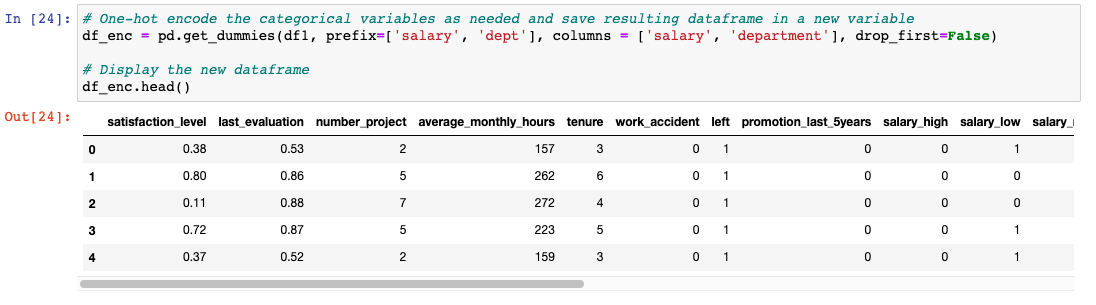
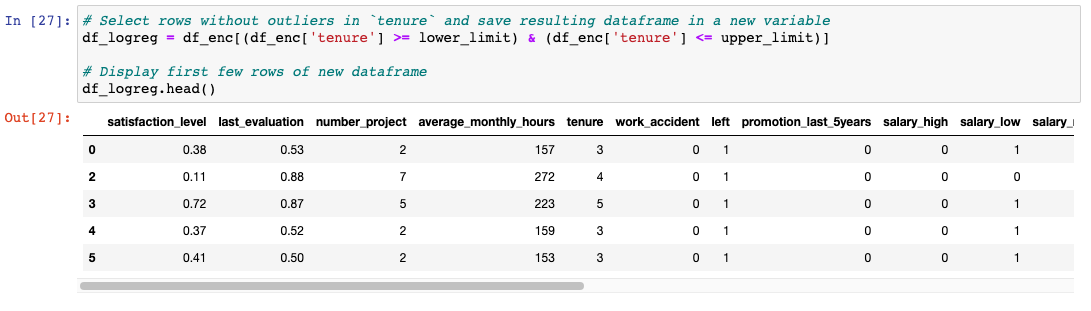
Since logistic regression is quite sensitive to outliers, it would be a good idea at this stage to remove the outliers in the tenure column that were identified earlier (Part 1: EDA of this dataset).
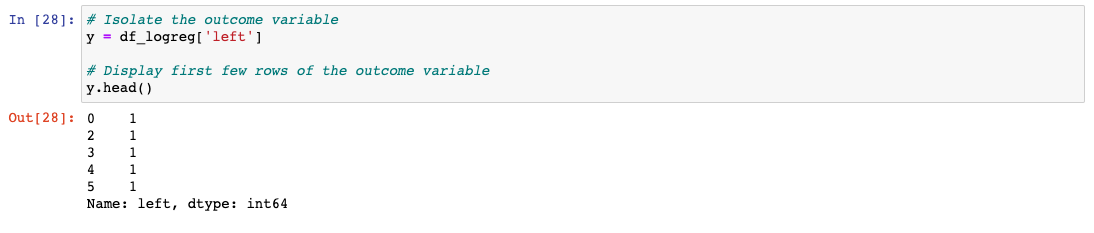
Next, I isolated the outcome variable, which is the variable we want our model to predict:
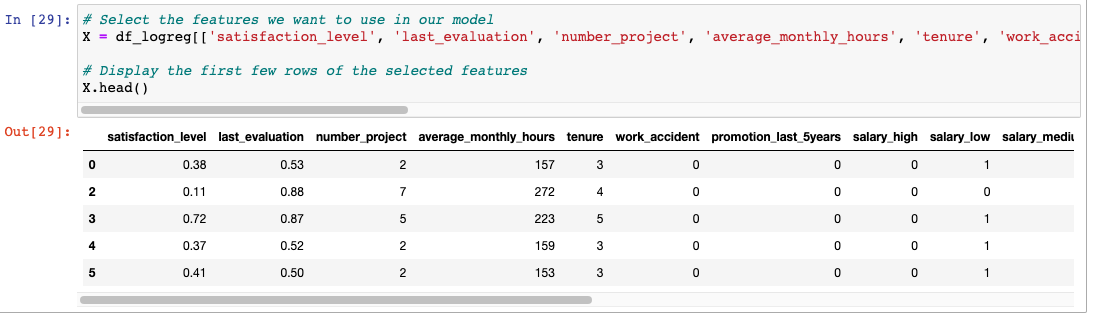
Next, I selected the features we want to use in our model. On this step we also need to consider which variables will help us predict the outcome variable, left
``
Next, we need to split the data into a training set and a testing set:

Then construct a logistic regression model and fit it to the training dataset:

After that, we need to test the logistic regression model (we have to use the model to make predictions on the test set):

Results
Next, I created a confusion matrix to visualize the results of the logistic regression model:
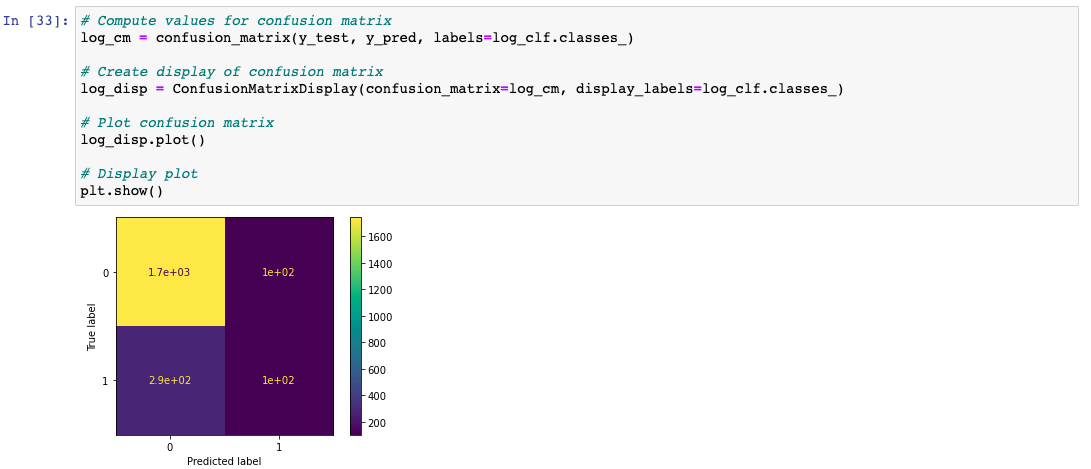
The upper-left quadrant displays the number of true negatives.
The upper-right quadrant displays the number of false positives.
The bottom-left quadrant displays the number of false negatives.
The bottom-right quadrant displays the number of true positives.
True negatives: The number of people who did not leave that the model accurately predicted did not leave.
False positives: The number of people who did not leave the model inaccurately predicted as leaving.
False negatives: The number of people who left that the model inaccurately predicted did not leave
True positives: The number of people who left the model accurately predicted as leaving
A perfect model would yield all true negatives and true positives, and no false negatives or false positives.
Model Evaluation
Next, I created a classification report that includes precision, recall, f1-score, and accuracy metrics to evaluate the performance of the logistic regression model.
In this step, we have to check the class balance in the data - check the value counts in the left column. Since this is a binary classification task, the class balance informs the way we interpret accuracy metrics.
There is an approximately 83%-17% split. So the data is not perfectly balanced, but it is not too imbalanced. If it was more severely imbalanced, you might want to resample the data to make it more balanced. In this case, we can use this data without modifying the class balance and continue evaluating the model.

Our evaluation metrics:
AUC is the area under the ROC curve; it's also considered the probability that the model ranks a random positive example more highly than a random negative example.
Precision measures the proportion of data points predicted as True that are actually True, in other words, the proportion of positive predictions that are true positives.
Recall measures the proportion of data points that are predicted as True, out of all the data points that are actually True. In other words, it measures the proportion of positives that are correctly classified.
Accuracy measures the proportion of data points that are correctly classified.
F1-score is an aggregation of precision and recall.
Results
The classification report shows that the logistic regression model achieved a precision of 80%, recall of 83%, f1-score of 80% (all weighted averages), and accuracy of 83%, on the test set.
Conclusion and Recommendations
The models and the feature importances extracted from the models confirm that employees at the company are overworked.
To retain employees, the following recommendations could be presented to the stakeholders:
Cap the number of projects that employees can work on.
Consider promoting employees who have been with the company for at least four years, or conduct a further investigation about why four-year tenured employees are so dissatisfied.
Either reward employees for working longer hours, or don't require them to do so.
If employees aren't familiar with the company's overtime pay policies, inform them about this. If the expectations around workload and time off aren't explicit, make them clear.
Hold company-wide and within-team discussions to understand and address the company work culture, across the board and in specific contexts.
High evaluation scores should not be reserved for employees who work 200+ hours per month. Consider a proportionate scale for rewarding employees who contribute more/put in more effort.