Employee Retention. Part 1: Exploratory Data Analysis
Project Overview and Purpose
- Perform Exploratory Data analysis to figure out which variables have an impact on employee retention.
- Provide data-driven suggestions and insights for the HR department, based on my understanding of the data
- Built a Predictive Model that can predict whether or not an employee will leave the company and help identify factors that contribute to leaving
Dataset
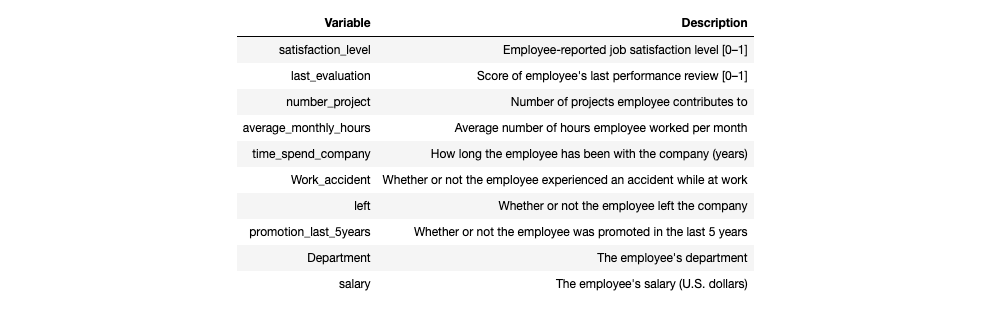
In this dataset, there are 14,999 rows, 10 columns, and these variables:
Technology Stack:
- Python Packages: Scikit-Learn, NLTK, Pandas, SciPy, Seaborn (load, explore, extract, and organize information)
- Jupyter Notebook (Exploratory Data Analysis)
Perform the Project
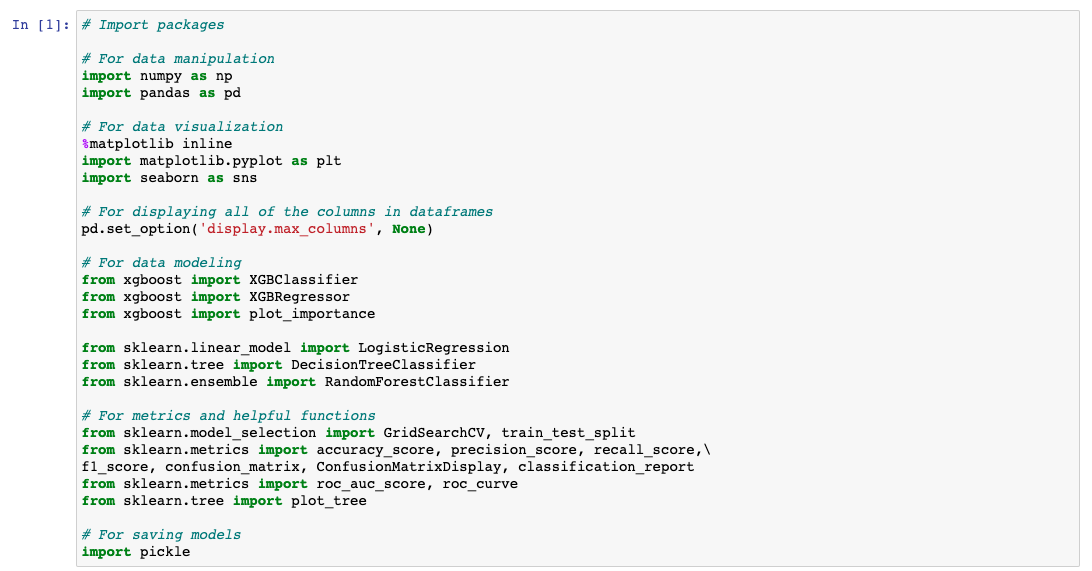
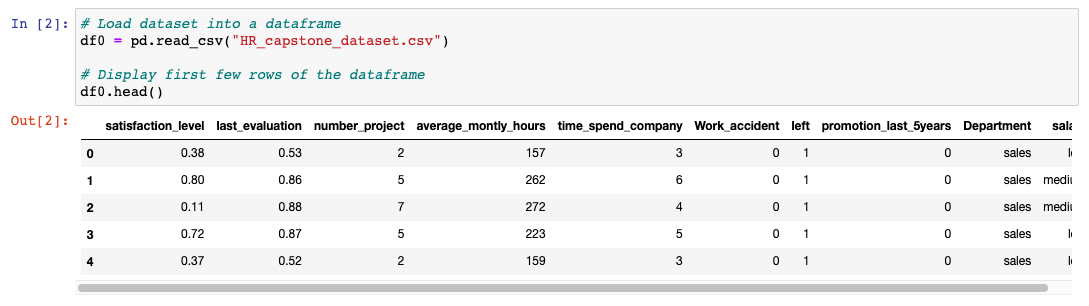
Step 1. Imports and load dataset
Step 2. Data Exploration: Initial EDA and Data Cleaning
Understand variables
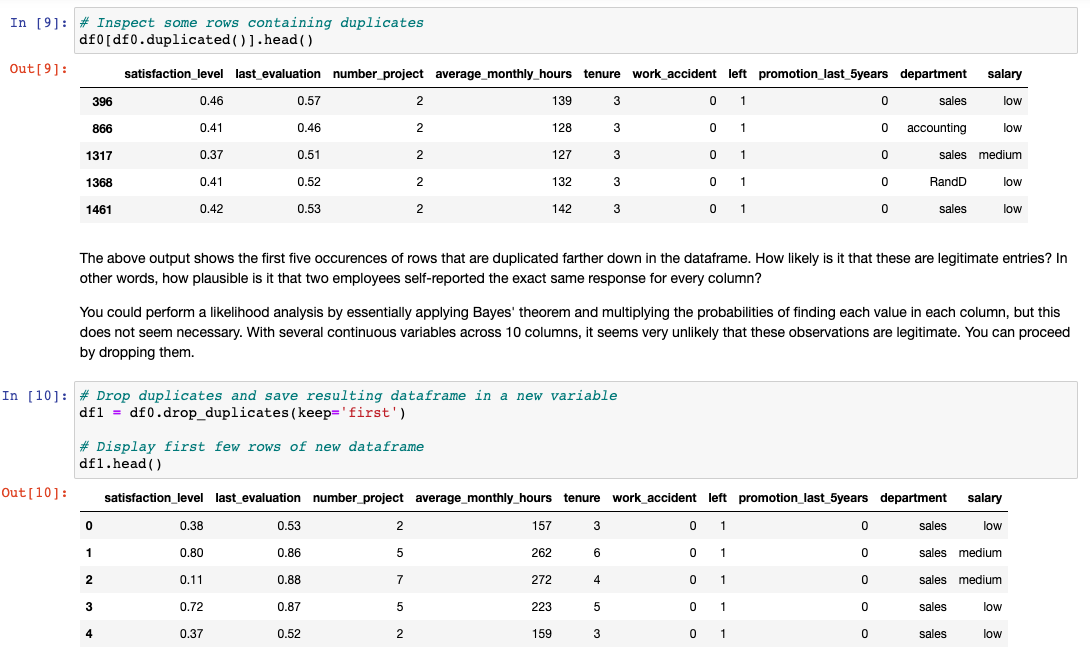
Clean the dataset (missing data, redundant data, outliers)
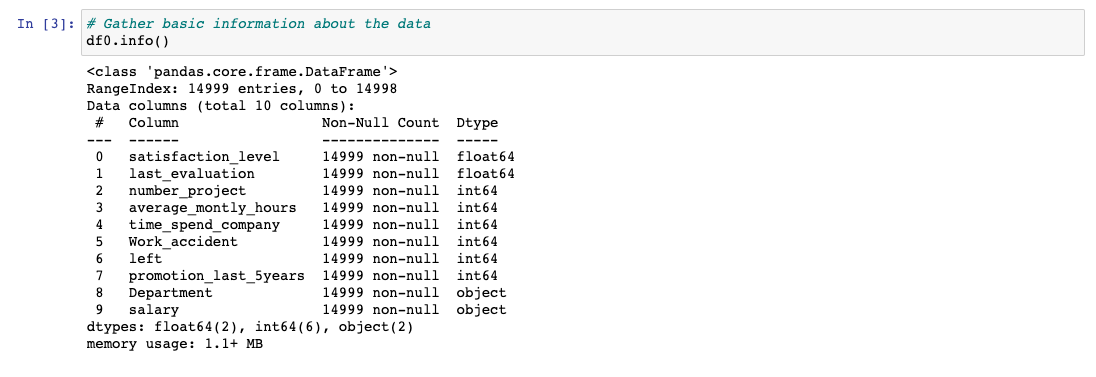
Gather basic information about the data
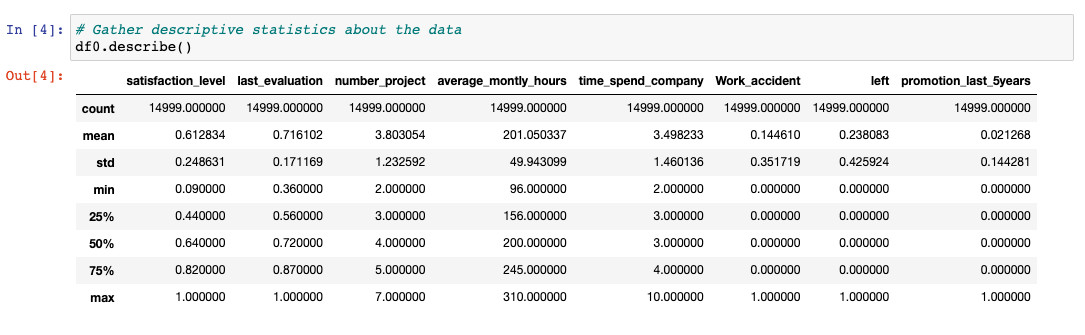
Gather descriptive statistics about the data
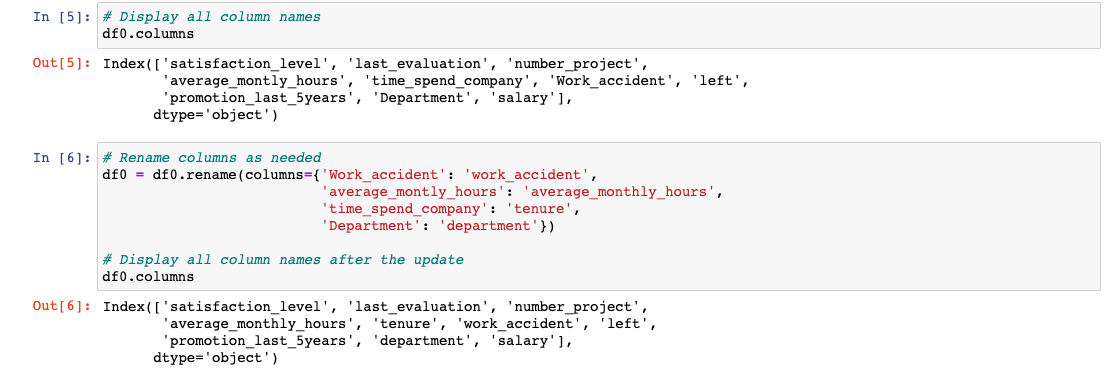
Rename columns As a data cleaning step, we need to rename some columns. The column names were standardized - all in snake_case, correct column names that were misspelled, also column names were made more concise.
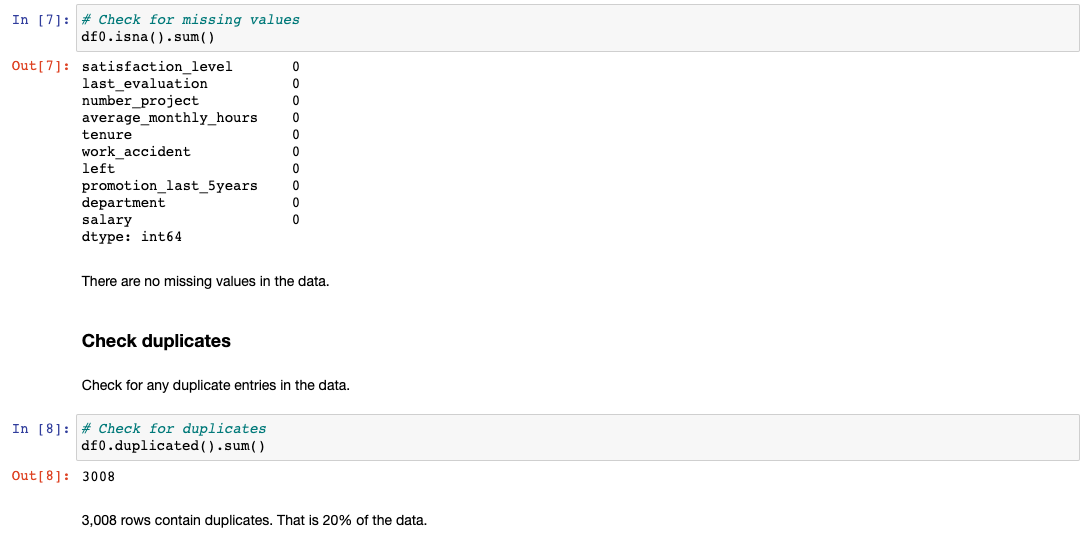
Check for any missing values in the data
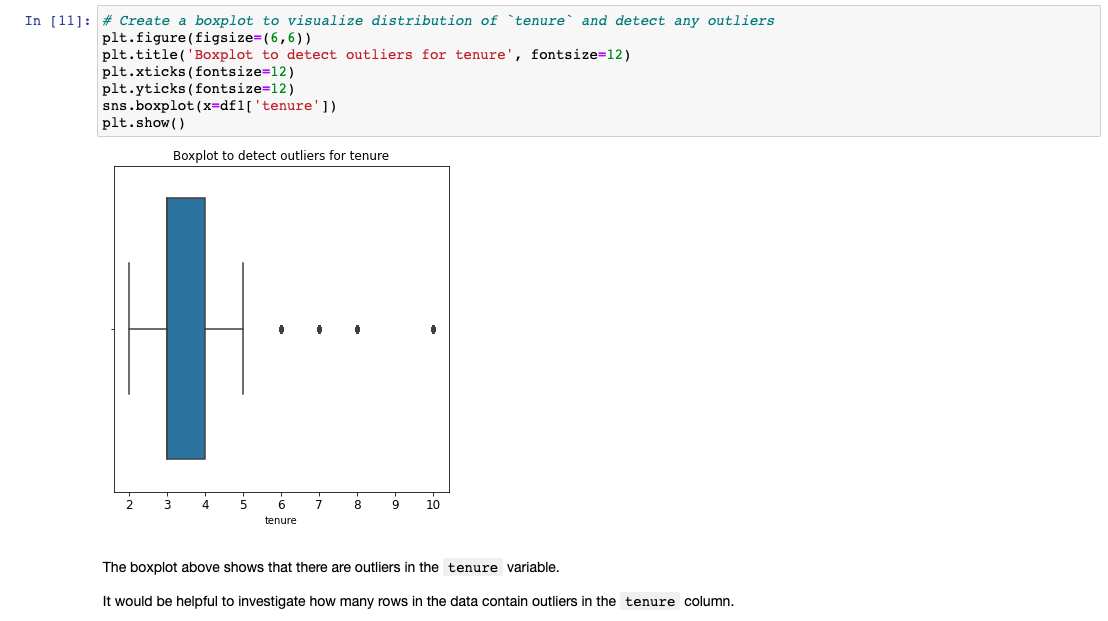
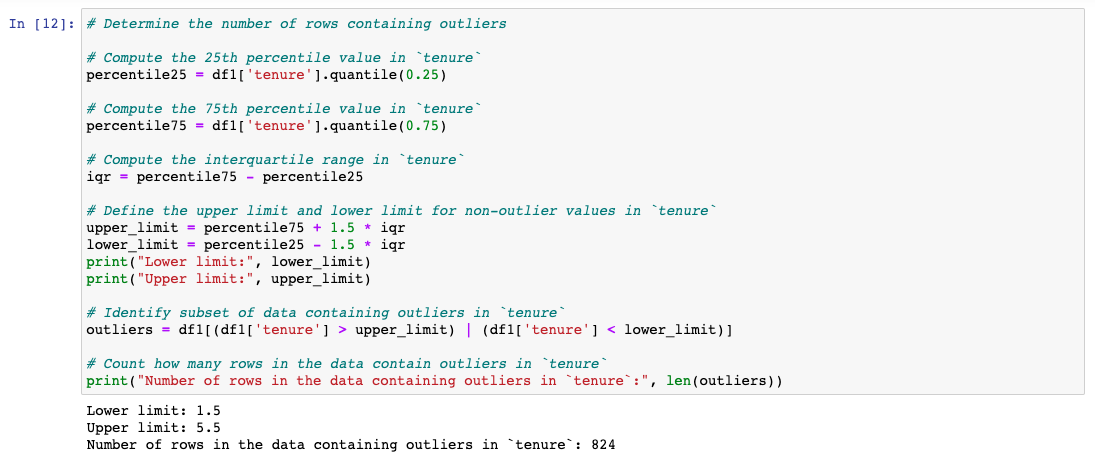
Check for outliers in the data
Step 3. Continue EDA: Analyze Relationships Between Variables
Now, I started examining the variables and creating plots to visualize relationships between variables in the data, comparing employees who stayed versus those who left
Number of projects and average monthly hours
First, I created a stacked boxplot (visualizing distributions within data) showing average_monthly_hours distributions for number_project, comparing the distributions of employees who stayed versus those who left.
Also, I plotted a stacked histogram to visualize the distribution of number_project those employees who stayed and those who left, because, although box plots are very useful in visualizing distributions within data, they can be deceiving without the context of how big the sample sizes that they represent are.
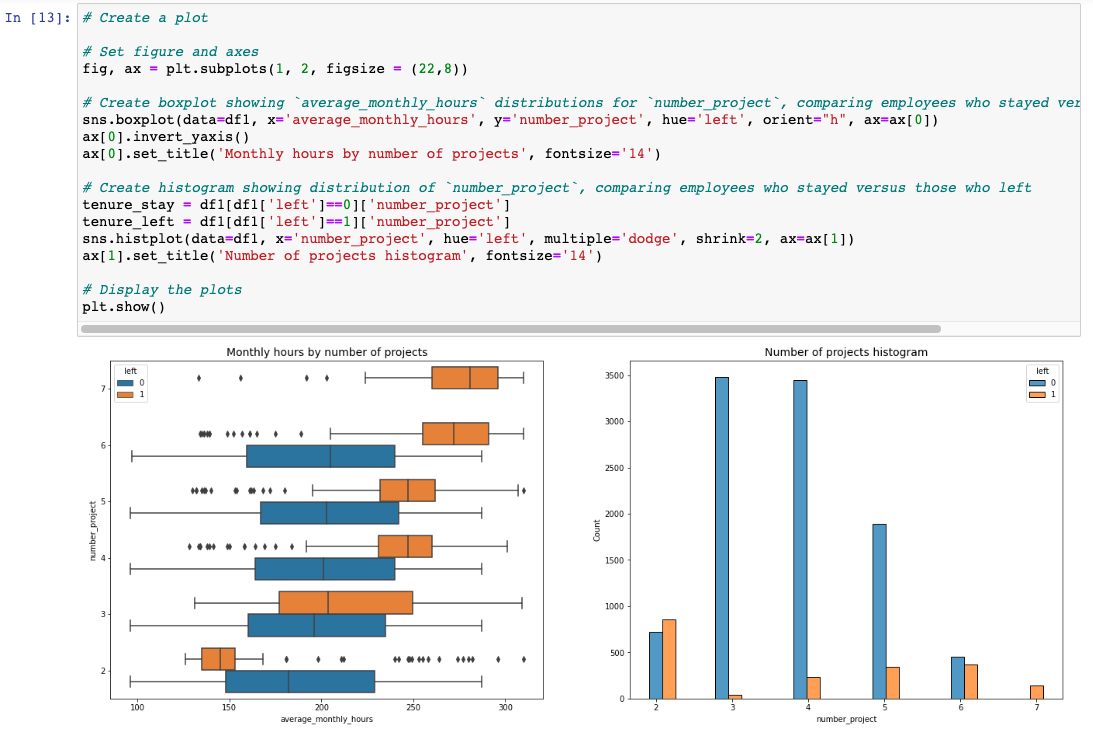
It might be natural that people who work on more projects would also work longer hours. This appears to be the case here, with the mean hours of each group (stayed and left) increasing with the number of projects worked. However, a few things stand out from this plot:
There are two groups of employees who left the company: (A) those who worked considerably less than their peers with the same number of projects, and (B) those who worked much more. Of those in group A, it's possible that they were fired. It's also possible that this group includes employees who had already given their notice and were assigned fewer hours because they were already on their way out the door. For those in group B, it's reasonable to infer that they probably quit. The folks in group B likely contributed a lot to the projects they worked on; they might have been the largest contributors to their projects.
Everyone with 7 projects left the company, and the interquartile ranges of this group and those who left with six projects was ~255–295 hours/week—much more than any other group.
The optimal number of projects for employees to work on seems to be 3–4. The ratio of left/stayed is very small for these cohorts.
If we assume a work week of 40 hours and two weeks of vacation per year, then the average number of working hours per month of employees working Monday–Friday
= 50 weeks * 40 hours per week / 12 months = 166.67 hours per month. This means that, aside from the employees who worked on two projects, every group—even those who didn't leave the company—worked considerably more hours than this. It seems that employees here are overworked.
As the next step, I needed to confirm that all employees with 7 projects left:
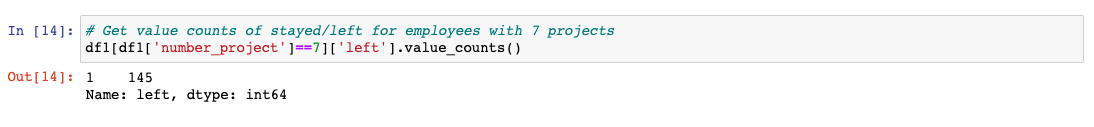
This confirms that all employees with 7 projects did leave.
Average monthly hours versus the satisfaction levels
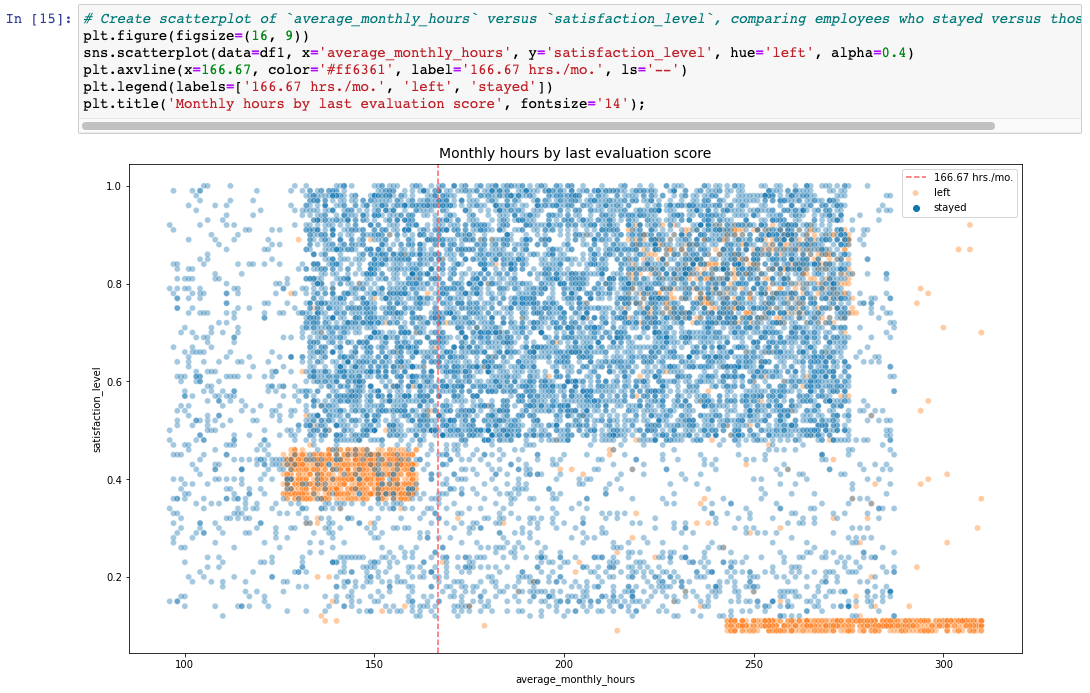
The scatterplot above shows that there was a sizeable group of employees who worked ~240–315 hours per month. 315 hours per month is over 75 hours per week for a whole year. It's likely this is related to their satisfaction levels being close to zero.
The plot also shows another group of people who left, those who had more normal working hours. Even so, their satisfaction was only around 0.4. It's difficult to speculate about why they might have left. It's possible they felt pressured to work more, considering so many of their peers worked more. And that pressure could have lowered their satisfaction levels.
Finally, there is a group who worked ~210–280 hours per month, and they had satisfaction levels ranging ~0.7–0.9.
Satisfaction levels and tenure
It might be interesting to visualize satisfaction levels by tenure:
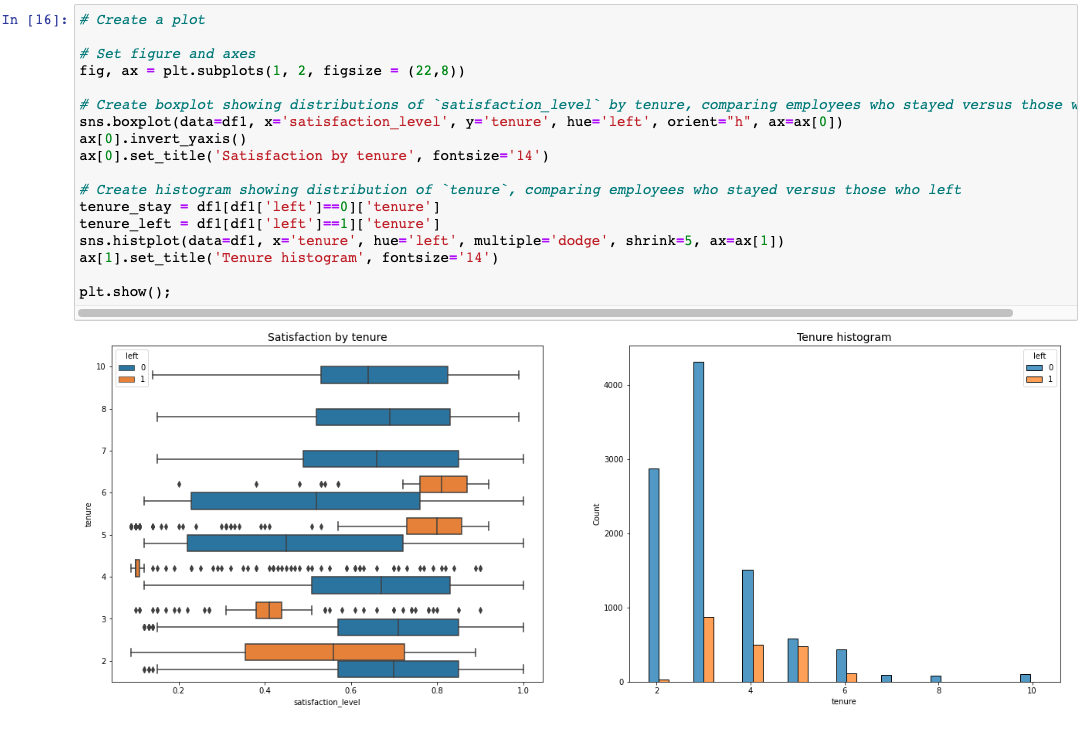
My observations from this plot:
Employees who left fall into two general categories: dissatisfied employees with shorter tenures and very satisfied employees with medium-length tenures.
Four-year employees who left seem to have an unusually low satisfaction level. It's worth investigating changes to company policy that might have affected people specifically at the four-year mark, if possible.
The longest-tenured employees didn't leave. Their satisfaction levels aligned with those of newer employees who stayed.
The histogram shows that there are relatively few longer-tenured employees. It's possible that they're the higher-ranking, higher-paid employees.
Mean and median satisfaction scores of employees who left and those who didn't
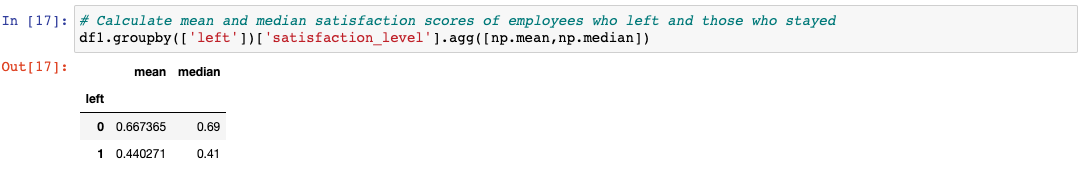
As expected, the mean and median satisfaction scores of employees who left are lower than those of employees who stayed. Interestingly, among employees who stayed, the mean satisfaction score appears to be slightly below the median score. This indicates that satisfaction levels among those who stayed might be skewed to the left.
Salary levels and different tenures
Let's examine salary levels for different tenures:
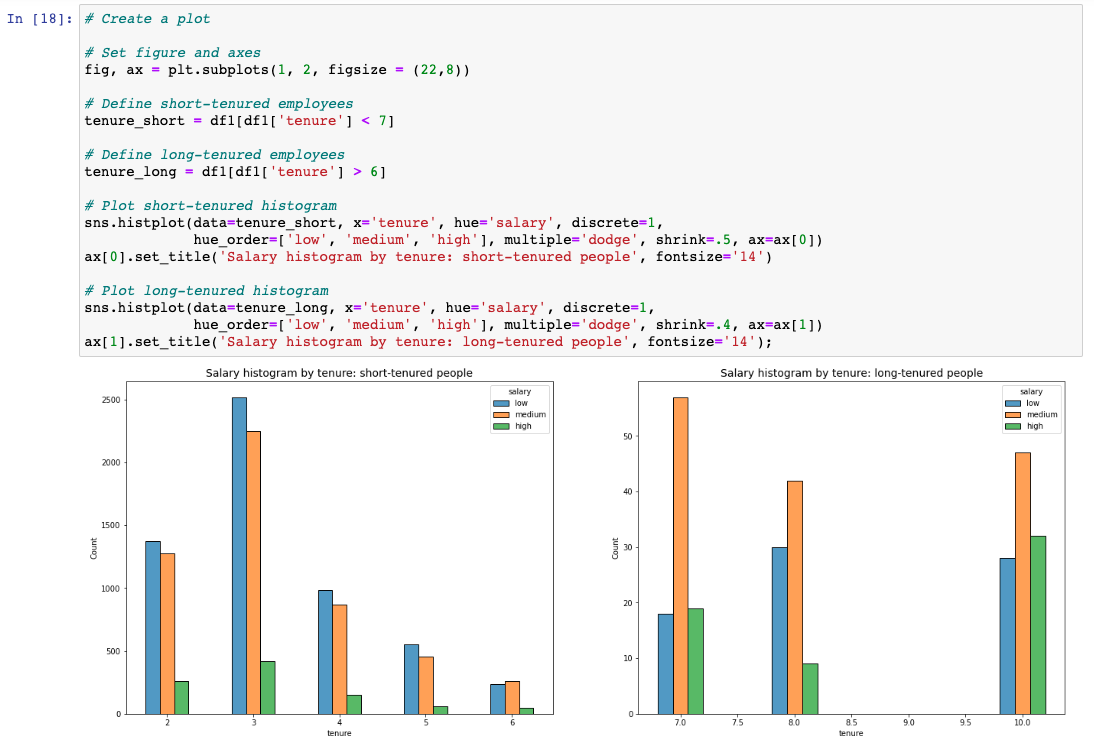
The plots above show that long-tenured employees were not disproportionately comprised of higher-paid employees.
Average monthly hours and evaluation scores
Next, I explored whether there's a correlation between working long hours and receiving high evaluation scores. I created a scatterplot of average_monthly_hours vs last_evaluation:
``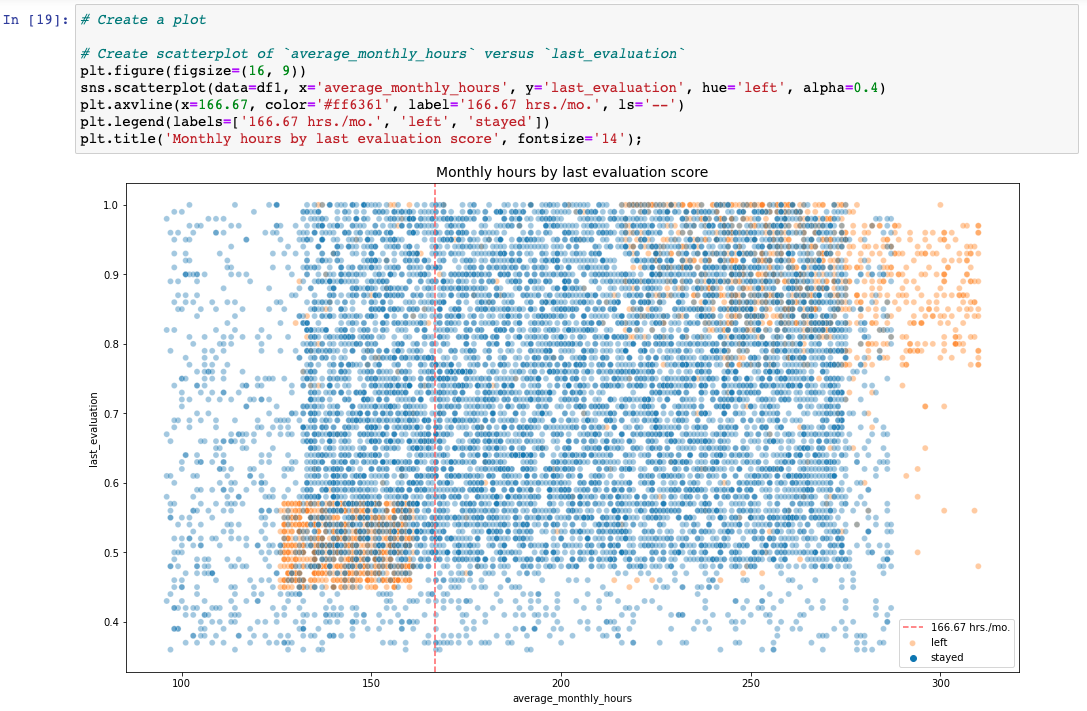
The following observations can be made from the scatterplot above:
The scatterplot indicates two groups of employees who left: overworked employees who performed very well and employees who worked slightly under the nominal monthly average of 166.67 hours with lower evaluation scores.
There seems to be a correlation between hours worked and evaluation score.
There isn't a high percentage of employees in the upper left quadrant of this plot, but working long hours doesn't guarantee a good evaluation score.
Most of the employees in this company work well over 167 hours per month.
Average monthly hours and promotion
Next, let's examine whether employees who worked very long hours were promoted in the last five years:
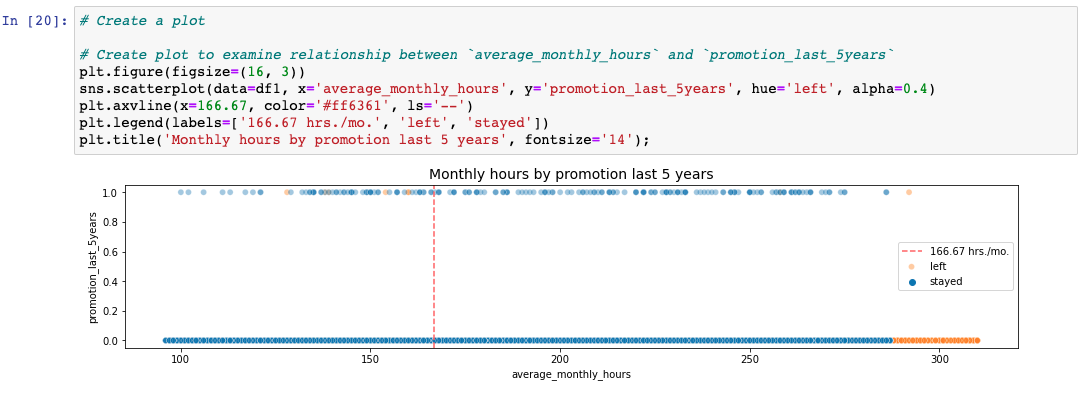
The plot above shows the following:
very few employees who were promoted in the last five years left
very few employees who worked the most hours were promoted
all of the employees who left were working the longest hours
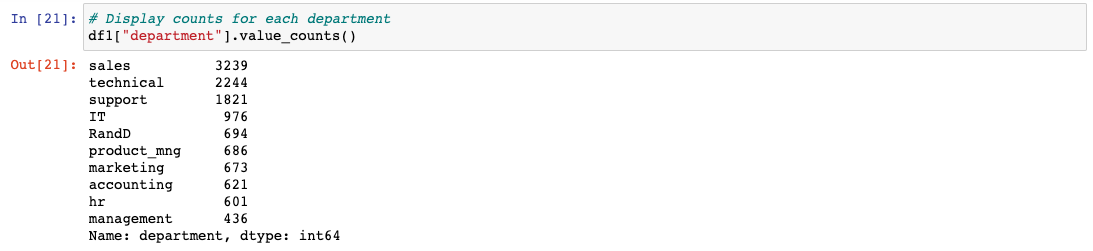
Distribution of employees who left across departments
Next, I inspected how the employees who left are distributed across departments:
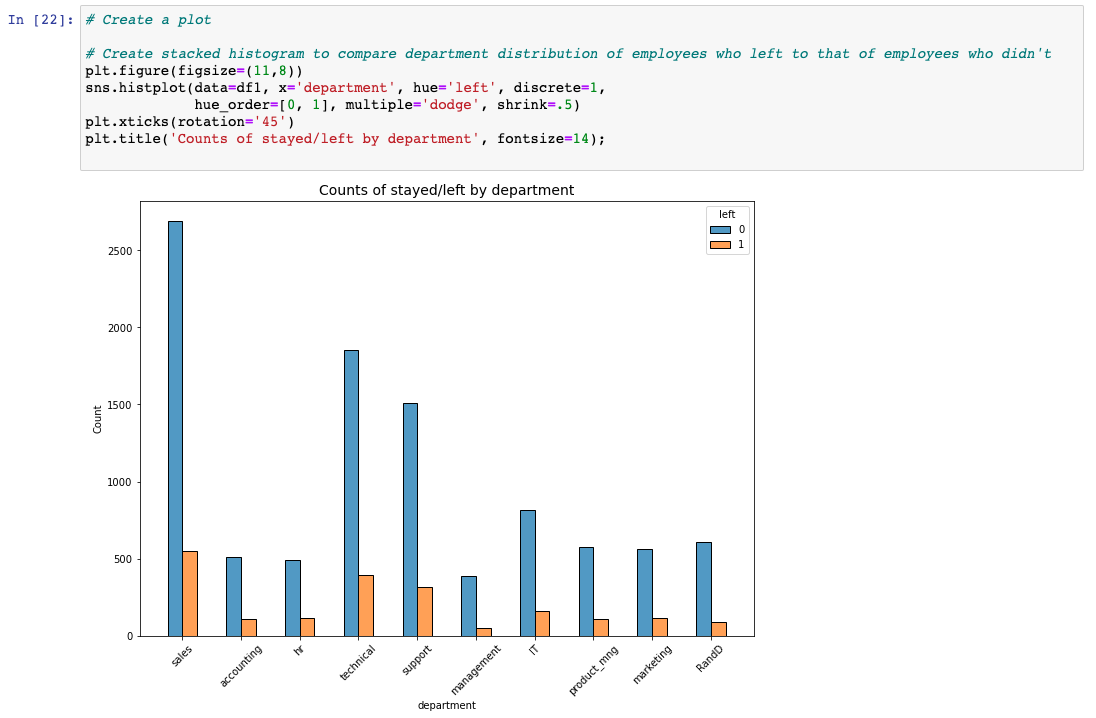
There doesn't seem to be any department that differs significantly in its proportion of employees who left to those who stayed.
Correlation heatmap between variables in the dataset
Lastly, I checked for strong correlations between variables in the data:
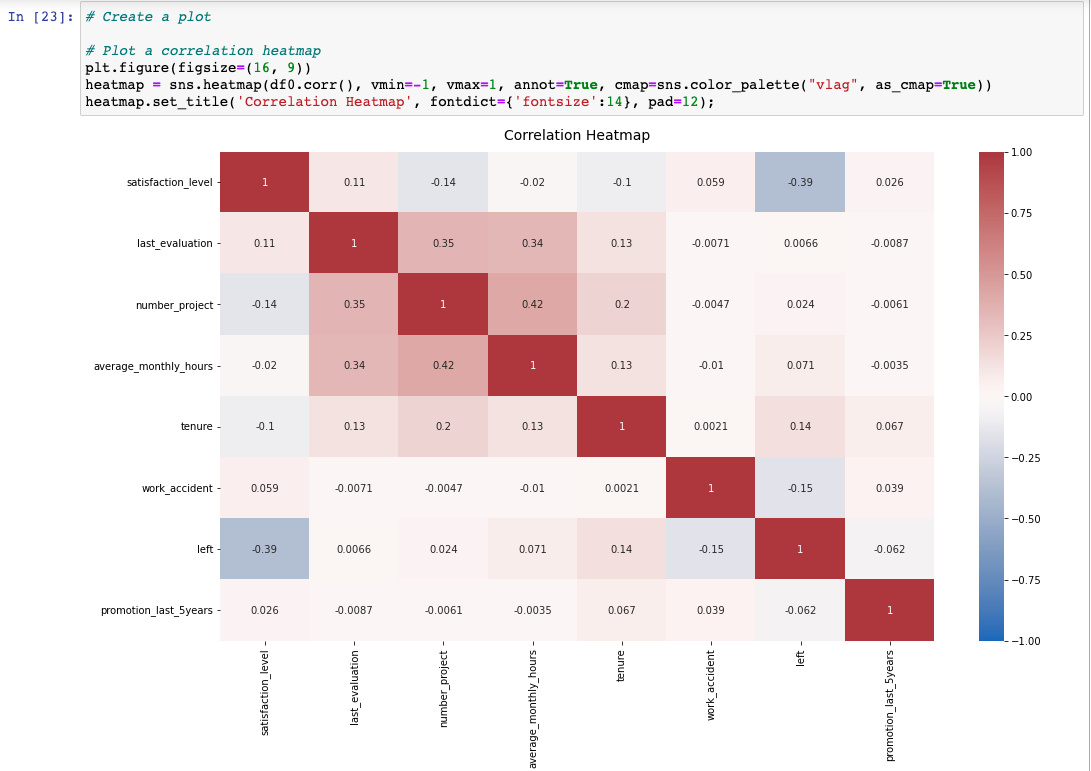
The correlation heatmap confirms that the number of projects, monthly hours, and evaluation scores all have some positive correlation with each other, and whether an employee leaves is negatively correlated with their satisfaction level.
Insights
It appears that employees are leaving the company as a result of poor management. Leaving is tied to longer working hours, many projects, and generally lower satisfaction levels.
It can be ungratifying to work long hours and not receive promotions or good evaluation scores. There's a sizeable group of employees at this company who are probably burned out.
It also appears that if an employee has spent more than six years at the company, they tend not to leave.